Transactions Per Product
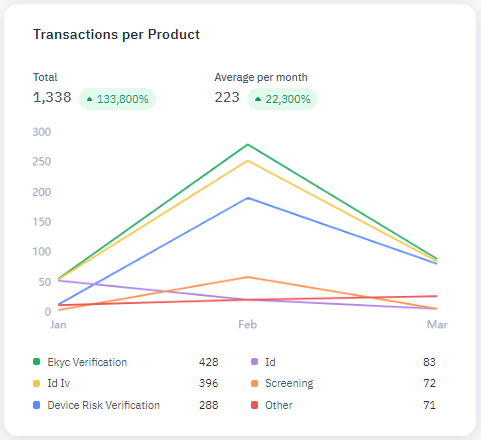
The Transactions per Product widget shows the following data:
-
Total: Total number of transactions
 An executed business process that is associated with an account. The transaction applies credentials for the account to a workflow and contains the decision rendered by the workflow. processed during the specified time frame along with the percentage change over the same time frame of the previous year.
 -
Avg per day/week/month: Average number of transactions processed per day, week, or month, depending on the selected time frame, along with the percentage change in this average over the same time frame of the previous year.
The line graph shows the total number of transactions over time for each Jumio product purchased by your organization. At the bottom of the graph are the number of transactions for the selected time frame broken down by product.
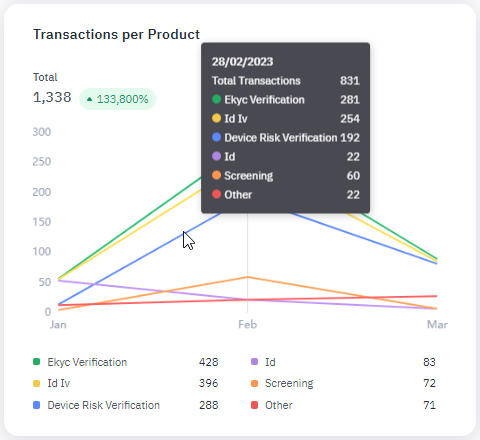
Hover your pointer over the graph to view the numbers broken down for a single day, week, or month.

